Machine Learning course menu
Multiple and Polynomial Regression in scikit-learn
Extend linear regression to many features, interpret coefficients, compare features on a common scale with standardisation, model curved relationships with PolynomialFeatures, and see how too high a degree overfits.
On this page
Real predictions depend on many things at once: a house price depends on its area, bedrooms, age and location. Multiple regression uses several features; polynomial regression bends the line to follow curves. Both are still "linear" models underneath, and both use LinearRegression.
Several features#
With features x₁, x₂, …, the model adds one coefficient per feature:
prediction = intercept + w₁·x₁ + w₂·x₂ + … + wₙ·xₙWe will use simulated house data where the true effects are known, so you can see the model recover them:
import numpy as np
import pandas as pd
from sklearn.linear_model import LinearRegression
from sklearn.model_selection import train_test_split

rng = np.random.default_rng(0)
n = 300
houses = pd.DataFrame({
    "area_sqft": rng.integers(500, 2500, n),
    "bedrooms": rng.integers(1, 5, n),
    "age_years": rng.integers(0, 40, n),
})
houses["price_lakh"] = (10 + 0.06 * houses["area_sqft"] + 4 * houses["bedrooms"]
                        - 0.5 * houses["age_years"] + rng.normal(0, 8, n)).round(1)

X = houses.drop(columns="price_lakh")
y = houses["price_lakh"]
X_train, X_test, y_train, y_test = train_test_split(X, y, test_size=0.25, random_state=0)

model = LinearRegression().fit(X_train, y_train)
print(pd.Series(model.coef_, index=X.columns).round(3))
print("intercept:", round(model.intercept_, 2))
print("test R²:", round(model.score(X_test, y_test), 3))area_sqft 0.059
bedrooms 3.948
age_years -0.541
dtype: float64
intercept: 12.41
test R²: 0.959The model recovered values close to the true ones (0.06 per square foot, 4 per bedroom, −0.5 per year of age). Each coefficient means: holding the other features fixed, one more unit of this feature changes the predicted price by this much.
Comparing feature importance#
Raw coefficients depend on units: 0.06 per square foot is not "smaller" than 4 per bedroom, because areas are in the thousands. Standardising the features (mean 0, standard deviation 1) puts every coefficient on the same scale, "change per standard deviation":
import numpy as np
import pandas as pd
from sklearn.linear_model import LinearRegression
from sklearn.preprocessing import StandardScaler

rng = np.random.default_rng(0)
n = 300
X = pd.DataFrame({
    "area_sqft": rng.integers(500, 2500, n),
    "bedrooms": rng.integers(1, 5, n),
    "age_years": rng.integers(0, 40, n),
})
y = 10 + 0.06 * X["area_sqft"] + 4 * X["bedrooms"] - 0.5 * X["age_years"] + rng.normal(0, 8, n)

X_scaled = StandardScaler().fit_transform(X)
model = LinearRegression().fit(X_scaled, y)
print(pd.Series(model.coef_, index=X.columns).round(2).sort_values(key=abs, ascending=False))area_sqft 35.41
age_years -5.75
bedrooms 4.84
dtype: float64Area has by far the biggest effect per standard deviation. (Strongly correlated features make coefficients unstable and hard to interpret; regularisation, next lesson, helps.)
Polynomial regression: curves#
When the relationship curves, add powers of the feature (x², x³, …) as new columns, then fit an ordinary linear regression on them. PolynomialFeatures creates the columns:
import numpy as np
from sklearn.preprocessing import PolynomialFeatures

x = np.array([[2], [3], [4]])
print(PolynomialFeatures(degree=3, include_bias=False).fit_transform(x))[[ 2. 4. 8.]
[ 3. 9. 27.]
[ 4. 16. 64.]]Comparing degrees on curved data shows both underfitting and overfitting:
import numpy as np
import matplotlib.pyplot as plt
from sklearn.linear_model import LinearRegression
from sklearn.model_selection import train_test_split
from sklearn.pipeline import make_pipeline
from sklearn.preprocessing import PolynomialFeatures

rng = np.random.default_rng(3)
x = np.sort(rng.uniform(0, 6, 40)).reshape(-1, 1)
y = np.sin(x).ravel() * 10 + rng.normal(0, 1.5, 40)
x_train, x_test, y_train, y_test = train_test_split(x, y, test_size=0.3, random_state=1)

fig, axes = plt.subplots(1, 3, figsize=(13, 3.8), sharey=True)
grid = np.linspace(0, 6, 200).reshape(-1, 1)
for ax, degree in zip(axes, [1, 4, 15]):
    model = make_pipeline(PolynomialFeatures(degree, include_bias=False), LinearRegression())
    model.fit(x_train, y_train)
    ax.scatter(x_train, y_train, s=15, label="train")
    ax.scatter(x_test, y_test, s=15, marker="x", label="test")
    ax.plot(grid, model.predict(grid), color="#C44E52")
    ax.set_ylim(-20, 20)
    ax.set_title(f"degree {degree}: train R² {model.score(x_train, y_train):.2f}, test R² {model.score(x_test, y_test):.2f}")
    print(degree, round(model.score(x_train, y_train), 3), round(model.score(x_test, y_test), 3))
axes[0].legend()
fig.tight_layout()
plt.show()1 0.58 0.502
4 0.964 0.939
15 0.977 0.927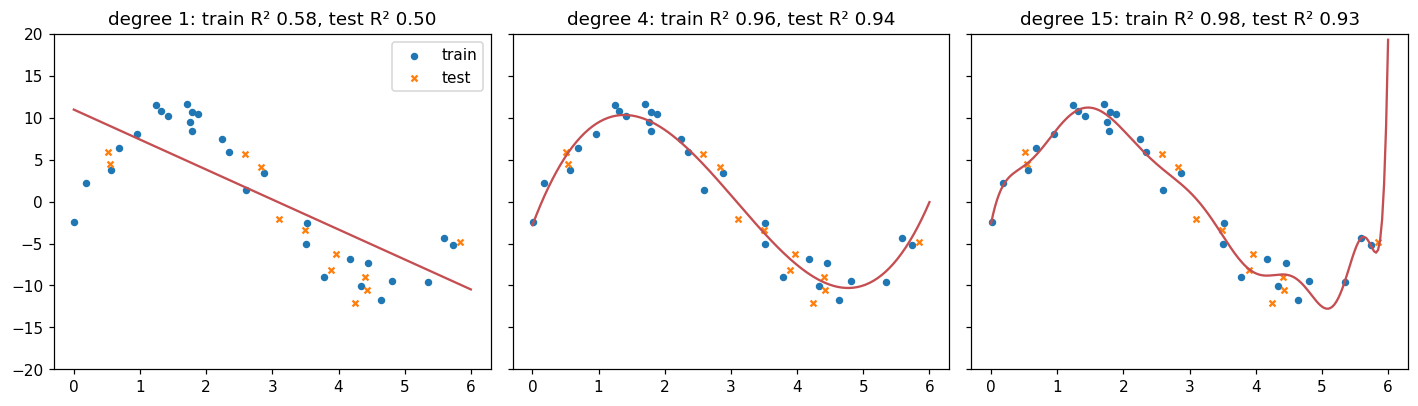
- Degree 1 (a straight line) underfits: it cannot follow the curve, so both scores are low.
- Degree 4 captures the shape and scores well on both training and test data.
- Degree 15 overfits: it bends to chase noise in the training points, so its training score is the highest but its test score drops.
The test score, not the training score, decides which model is best. Cross-validation picks the degree systematically.
Common mistakes#
Practice#
Practice exercise
Using load_diabetes(return_X_y=True, as_frame=True), split 80/20 with random_state=0, fit a linear regression on all features, and print the test R² (3 decimals) and the three features with the largest absolute coefficients. (The features in this dataset are already scaled.)
Show hint
as_frame=True returns a DataFrame, so you can label the coefficients with X.columns, then sort by absolute value with sort_values(key=abs).
Show solution
import pandas as pd
from sklearn.datasets import load_diabetes
from sklearn.linear_model import LinearRegression
from sklearn.model_selection import train_test_split

X, y = load_diabetes(return_X_y=True, as_frame=True)
X_train, X_test, y_train, y_test = train_test_split(X, y, test_size=0.2, random_state=0)
model = LinearRegression().fit(X_train, y_train)
print(round(model.score(X_test, y_test), 3))
coefs = pd.Series(model.coef_, index=X.columns)
print(coefs.sort_values(key=abs, ascending=False).head(3).round(1))0.332
s5 731.6
s1 -662.7
bmi 562.8
dtype: float64Key takeaway#
Finished this lesson?