Machine Learning course menu
k-Means Clustering in Python: Customer Segmentation Example
Learn k-means clustering: how the algorithm assigns points and moves centroids, scaling features, choosing k with the elbow method and silhouette score, interpreting clusters as customer segments, and the limits of k-means.
On this page
Clustering groups similar items together without any labels. It is the most common kind of unsupervised learning: segmenting customers by behaviour, grouping documents by topic, or finding similar products. k-means is the classic clustering algorithm.
How k-means works#
You choose the number of clusters, k. Then:
- Place k centroids (cluster centres), for example at random points.
- Assign each point to its nearest centroid.
- Move each centroid to the average of the points assigned to it.
- Repeat steps 2 and 3 until the assignments stop changing.
import numpy as np

points = np.array([[1, 1], [1.5, 2], [1, 1.5], [8, 8], [8.5, 9], [9, 8]])
centroids = np.array([[1, 1], [1.5, 2]])           # a poor start: both in one group
for step in range(1, 4):
    distances = np.linalg.norm(points[:, None] - centroids[None], axis=2)
    labels = distances.argmin(axis=1)
    centroids = np.array([points[labels == k].mean(axis=0) for k in range(2)])
print(f"step {step}: labels {labels.tolist()}, centroids {centroids.round(2).tolist()}")step 1: labels [0, 1, 0, 1, 1, 1], centroids [[1.0, 1.25], [6.75, 6.75]]
step 2: labels [0, 0, 0, 1, 1, 1], centroids [[1.17, 1.5], [8.5, 8.33]]
step 3: labels [0, 0, 0, 1, 1, 1], centroids [[1.17, 1.5], [8.5, 8.33]]Even from a poor start, the centroids move to the two natural groups within a couple of steps. scikit-learn's KMeans uses a smarter starting method (k-means++) and runs several starts, keeping the best.
Segmenting customers#
Simulated customers described by annual spend and number of orders:
import numpy as np
import pandas as pd
import matplotlib.pyplot as plt
from sklearn.cluster import KMeans
from sklearn.preprocessing import StandardScaler

rng = np.random.default_rng(3)
groups = [((8000, 4), 120), ((30000, 25), 60), ((15000, 10), 100)]
customers = pd.DataFrame(np.vstack([
    np.column_stack([rng.normal(m[0], m[0] * 0.15, n), rng.normal(m[1], m[1] * 0.2, n)]) for m, n in groups
]), columns=["annual_spend", "orders"])

X = StandardScaler().fit_transform(customers)
kmeans = KMeans(n_clusters=3, n_init=10, random_state=0).fit(X)
customers["segment"] = kmeans.labels_

print(customers.groupby("segment").agg(customers=("orders", "size"),
                                       avg_spend=("annual_spend", "mean"),
                                       avg_orders=("orders", "mean")).round(0))

fig, ax = plt.subplots(figsize=(6.5, 4.5))
for seg, part in customers.groupby("segment"):
    ax.scatter(part["orders"], part["annual_spend"], s=15, label=f"segment {seg}")
ax.set(xlabel="orders per year", ylabel="annual spend (₹)", title="k-means customer segments")
ax.legend()
plt.show() customers avg_spend avg_orders
segment
0 60 31093.0 25.0
1 122 8000.0 4.0
2 98 15313.0 10.0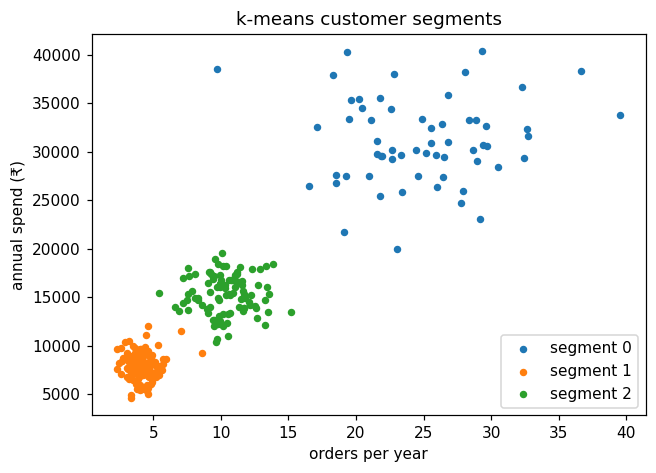
The summary table is how clusters become useful: give each segment a name ("occasional", "regular", "VIP") and a strategy. Cluster numbers themselves are arbitrary; running again with another random_state may number them differently.
Scale first. k-means uses distances, so without scaling, annual spend (thousands of rupees) would completely dominate the number of orders.
Choosing k#
With no labels, there is no "right answer" to check. Two common guides:
- Inertia (the elbow method): the total squared distance from points to their centroid. It always decreases as k grows; look for the "elbow" where adding clusters stops helping much.
- Silhouette score: how much closer each point is to its own cluster than to the next nearest one, from −1 to 1. Higher is better.
import numpy as np
from sklearn.cluster import KMeans
from sklearn.metrics import silhouette_score
from sklearn.preprocessing import StandardScaler

rng = np.random.default_rng(3)
groups = [((8000, 4), 120), ((30000, 25), 60), ((15000, 10), 100)]
X = np.vstack([np.column_stack([rng.normal(m[0], m[0] * 0.15, n), rng.normal(m[1], m[1] * 0.2, n)]) for m, n in groups])
X = StandardScaler().fit_transform(X)

for k in range(2, 7):
    km = KMeans(n_clusters=k, n_init=10, random_state=0).fit(X)
print(f"k={k}: inertia {km.inertia_:7.1f}, silhouette {silhouette_score(X, km.labels_):.3f}")k=2: inertia 116.6, silhouette 0.741
k=3: inertia 50.8, silhouette 0.698
k=4: inertia 35.5, silhouette 0.647
k=5: inertia 28.3, silhouette 0.650
k=6: inertia 24.6, silhouette 0.650The inertia drops sharply from k=2 to k=3 and only slowly after that, so the elbow is at 3, matching how the data was generated. The silhouette score, though, is highest at k=2: the low- and mid-spending groups sit fairly close together, so merging them still gives well-separated clusters. The two guides disagree, which is common with real data. The final choice also depends on what is useful: here three segments with distinct strategies beat two, and five segments a marketing team can act on beat twelve they cannot.
Assigning new points#
A fitted model assigns new customers to the nearest segment with predict (after the same scaling):
import numpy as np
from sklearn.cluster import KMeans
from sklearn.pipeline import make_pipeline
from sklearn.preprocessing import StandardScaler

rng = np.random.default_rng(3)
groups = [((8000, 4), 120), ((30000, 25), 60), ((15000, 10), 100)]
X = np.vstack([np.column_stack([rng.normal(m[0], m[0] * 0.15, n), rng.normal(m[1], m[1] * 0.2, n)]) for m, n in groups])

model = make_pipeline(StandardScaler(), KMeans(n_clusters=3, n_init=10, random_state=0)).fit(X)
new_customers = np.array([[7500, 3], [32000, 27]])
print(model.predict(new_customers))
print(model.predict(np.array([[8200, 5]])) == model.predict(np.array([[7500, 3]])))[1 0]
[ True]The low spender joins segment 1 and the big spender joins segment 0, matching the segment averages in this run, and a similar low spender lands in the same segment.
Limits of k-means#
- You must choose k.
- It assumes roughly round, similarly sized clusters; long, curved or very uneven clusters are split badly. DBSCAN finds arbitrarily shaped clusters and marks outliers; hierarchical clustering builds a tree of clusters at every level.
- Results depend on scaling and on the starting centroids (
n_initreduces this). - It works with numeric features; categorical data needs encoding or a different method.
Common mistakes#
Practice#
Practice exercise
Cluster the iris measurements (load_iris(return_X_y=True), ignoring the labels) into 3 clusters after scaling, then compare with the true species using pd.crosstab(labels, species). How well do the clusters match?
Show hint
Fit KMeans(n_clusters=3, n_init=10, random_state=0) on the scaled features, then cross-tabulate kmeans.labels_ against y.
Show solution
import pandas as pd
from sklearn.cluster import KMeans
from sklearn.datasets import load_iris
from sklearn.preprocessing import StandardScaler

X, y = load_iris(return_X_y=True)
labels = KMeans(n_clusters=3, n_init=10, random_state=0).fit_predict(StandardScaler().fit_transform(X))
print(pd.crosstab(labels, y, rownames=["cluster"], colnames=["species"]))species 0 1 2
cluster
0 0 39 14
1 50 0 0
2 0 11 36One species (setosa) gets a cluster of its own; the other two species overlap in their measurements, so k-means mixes them partly. Without labels, it found most but not all of the real structure.
Key takeaway#
Finished this lesson?