Machine Learning course menu
Logistic Regression in Python: Classification with Probabilities
Learn logistic regression for classification: the sigmoid function, predicting probabilities with predict_proba, the decision threshold, interpreting coefficients as odds, multi-class classification, and scaling with a pipeline.
On this page
Despite its name, logistic regression is a classification algorithm. It predicts the probability that an example belongs to a class (spam, fraud, will churn), and it is the standard first model for yes/no problems: fast, reliable and easy to interpret.
From a line to a probability#
Linear regression produces any number, but a probability must be between 0 and 1. Logistic regression computes a linear score and passes it through the sigmoid function, which squashes any number into that range:
probability = 1 / (1 + e^(−score)), score = intercept + w₁·x₁ + … + wₙ·xₙimport numpy as np
import matplotlib.pyplot as plt
z = np.linspace(-8, 8, 200)
sigmoid = 1 / (1 + np.exp(-z))
fig, ax = plt.subplots(figsize=(7, 3.5))
ax.plot(z, sigmoid, color="#4C72B0")
ax.axhline(0.5, color="grey", linestyle="--", linewidth=0.8)
ax.axvline(0, color="grey", linestyle="--", linewidth=0.8)
ax.set(xlabel="linear score", ylabel="probability", title="The sigmoid function")
plt.show()
print([round(float(1 / (1 + np.exp(-v))), 3) for v in [-4, -1, 0, 1, 4]])[0.018, 0.269, 0.5, 0.731, 0.982]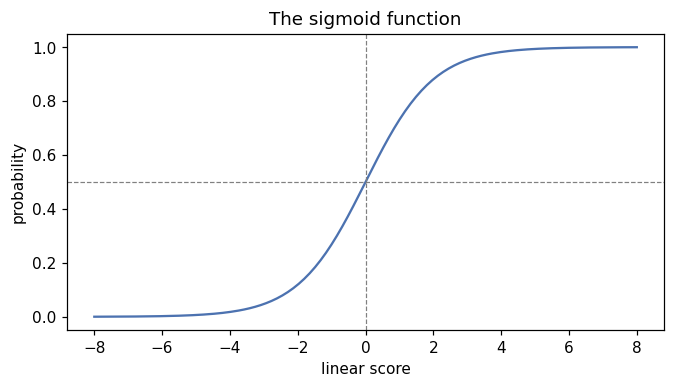
A score of 0 gives a probability of 0.5; large positive scores approach 1, large negative scores approach 0.
Training a classifier#
Predicting whether a customer will buy, from minutes spent on the site and pages viewed (simulated data):
import numpy as np
import pandas as pd
from sklearn.linear_model import LogisticRegression
from sklearn.model_selection import train_test_split

rng = np.random.default_rng(5)
n = 400
visits = pd.DataFrame({"minutes": rng.uniform(1, 30, n), "pages": rng.integers(1, 20, n)})
score = -6 + 0.2 * visits["minutes"] + 0.25 * visits["pages"]
visits["bought"] = (rng.random(n) < 1 / (1 + np.exp(-score))).astype(int)

X = visits[["minutes", "pages"]]
y = visits["bought"]
X_train, X_test, y_train, y_test = train_test_split(X, y, test_size=0.25, random_state=0, stratify=y)

model = LogisticRegression().fit(X_train, y_train)
print("accuracy:", round(model.score(X_test, y_test), 3))
print("coefficients:", model.coef_.round(3), "intercept:", model.intercept_.round(3))

new_visitors = pd.DataFrame({"minutes": [3, 15, 28], "pages": [2, 8, 15]})
print(model.predict_proba(new_visitors).round(3))
print(model.predict(new_visitors))accuracy: 0.84
coefficients: [[0.177 0.244]] intercept: [-5.469]
[[0.988 0.012]
[0.704 0.296]
[0.042 0.958]]
[0 0 1]predict_proba returns one column per class: the probability of 0 (no purchase) and of 1 (purchase). predict returns the class with the higher probability, which means using a threshold of 0.5.
Changing the threshold#
0.5 is not always the right cut-off. If missing a buyer is cheap but a wasted discount is expensive, you might only target visitors above 0.7. Lowering the threshold catches more positives at the cost of more false alarms:
import numpy as np
import pandas as pd
from sklearn.linear_model import LogisticRegression
from sklearn.model_selection import train_test_split

rng = np.random.default_rng(5)
n = 400
visits = pd.DataFrame({"minutes": rng.uniform(1, 30, n), "pages": rng.integers(1, 20, n)})
score = -6 + 0.2 * visits["minutes"] + 0.25 * visits["pages"]
visits["bought"] = (rng.random(n) < 1 / (1 + np.exp(-score))).astype(int)
X_train, X_test, y_train, y_test = train_test_split(visits[["minutes", "pages"]], visits["bought"],
                                                    test_size=0.25, random_state=0, stratify=visits["bought"])
model = LogisticRegression().fit(X_train, y_train)

proba = model.predict_proba(X_test)[:, 1]
for threshold in [0.3, 0.5, 0.7]:
    predicted = (proba >= threshold).astype(int)
    caught = ((predicted == 1) & (y_test == 1)).sum()
    flagged = predicted.sum()
print(f"threshold {threshold}: flagged {flagged}, of which real buyers {caught} (of {y_test.sum()} buyers)")threshold 0.3: flagged 61, of which real buyers 41 (of 43 buyers)
threshold 0.5: flagged 43, of which real buyers 35 (of 43 buyers)
threshold 0.7: flagged 35, of which real buyers 30 (of 43 buyers)Choosing the threshold is a business decision; Classification Metrics gives the tools (precision, recall, ROC curves) to make it.
Interpreting coefficients#
A positive coefficient raises the probability; a negative one lowers it. More precisely, a one-unit increase in a feature multiplies the odds (p / (1 − p)) by e^coefficient:
import numpy as np

coefficients = {"minutes": 0.2, "pages": 0.25}
for feature, c in coefficients.items():
print(feature, "odds multiplied by", round(np.exp(c), 3), "per unit")minutes odds multiplied by 1.221 per unit
pages odds multiplied by 1.284 per unitWith the true coefficients used to simulate the data, each extra page viewed multiplies the odds of buying by about 1.28 (a 28% increase in the odds).
More than two classes#
LogisticRegression also handles several classes, predicting a probability for each. Scaling the features first helps the solver converge:
from sklearn.datasets import load_wine
from sklearn.linear_model import LogisticRegression
from sklearn.model_selection import train_test_split
from sklearn.pipeline import make_pipeline
from sklearn.preprocessing import StandardScaler

X, y = load_wine(return_X_y=True)
X_train, X_test, y_train, y_test = train_test_split(X, y, test_size=0.25, random_state=0, stratify=y)
model = make_pipeline(StandardScaler(), LogisticRegression()).fit(X_train, y_train)
print("accuracy:", round(model.score(X_test, y_test), 3))
print(model.predict_proba(X_test[:2]).round(3))accuracy: 1.0
[[0.001 0.001 0.997]
[0.867 0.132 0.001]]Each row of probabilities sums to 1 across the three wine classes.
Common mistakes#
Practice#
Practice exercise
On the breast cancer dataset (load_breast_cancer(return_X_y=True)), split 75/25 with stratify and random_state=3, fit a scaled logistic regression, and print the test accuracy and how many test cases have a predicted probability between 0.3 and 0.7 (the uncertain ones).
Show hint
make_pipeline(StandardScaler(), LogisticRegression()); then proba = model.predict_proba(X_test)[:, 1] and count (proba > 0.3) & (proba < 0.7).
Show solution
from sklearn.datasets import load_breast_cancer
from sklearn.linear_model import LogisticRegression
from sklearn.model_selection import train_test_split
from sklearn.pipeline import make_pipeline
from sklearn.preprocessing import StandardScaler

X, y = load_breast_cancer(return_X_y=True)
X_train, X_test, y_train, y_test = train_test_split(X, y, test_size=0.25, stratify=y, random_state=3)
model = make_pipeline(StandardScaler(), LogisticRegression()).fit(X_train, y_train)
proba = model.predict_proba(X_test)[:, 1]
print(round(model.score(X_test, y_test), 3))
print(int(((proba > 0.3) & (proba < 0.7)).sum()), "uncertain cases of", len(proba))0.986
5 uncertain cases of 143In a real medical setting, uncertain cases like these are the ones to send for a specialist's review.
Key takeaway#
Next: Classification Metrics.
Finished this lesson?