Python for Data course menu
Python Sales Report Project: Automate a Monthly Report With pandas
Build an automated monthly sales report with pandas: load a year of transactions, compute revenue, growth and top products, build region pivot tables, chart the trend, and export a multi-sheet Excel report you can rerun every month.
On this page
Many analysts spend hours every month rebuilding the same spreadsheet report. In this project you write it once in Python: point the script at the latest data and it produces the numbers, a chart and an Excel file in seconds.
The report needs:
- Monthly revenue, orders and average order value, with month-over-month growth.
- The top products by revenue.
- Revenue by region and month.
- A trend chart.
- Everything saved to one Excel workbook.
Step 1: The data#
The code below generates a year of realistic transactions and saves them as transactions.csv, so the project is reproducible. In real work this file would come from your company's systems.
import numpy as np
import pandas as pd

rng = np.random.default_rng(31)
n = 4000
dates = pd.to_datetime("2025-07-01") + pd.to_timedelta(rng.integers(0, 365, n), unit="D")
products = {"Headphones": 2500, "Keyboard": 1500, "Mouse": 700, "Monitor": 12000, "Webcam": 3000, "USB Hub": 900}
names = rng.choice(list(products), n, p=[0.2, 0.15, 0.3, 0.08, 0.12, 0.15])
season = 1 + 0.35 * (pd.DatetimeIndex(dates).month.isin([10, 11]))   # festive season boost
qty = rng.integers(1, 4, n) * np.where(rng.random(n) < season - 0.65, 2, 1)

tx = pd.DataFrame({
    "date": dates,
    "region": rng.choice(["North", "South", "East", "West"], n, p=[0.3, 0.3, 0.2, 0.2]),
    "product": names,
    "quantity": qty,
    "unit_price": [products[p] for p in names],
}).sort_values("date", ignore_index=True)
tx.to_csv("transactions.csv", index=False)
print(tx.shape)
print(tx.head(3))(4000, 5)
date region product quantity unit_price
0 2025-07-01 South USB Hub 4 900
1 2025-07-01 North Mouse 3 700
2 2025-07-01 South Keyboard 3 1500Step 2: Load and prepare#
import pandas as pd

tx = pd.read_csv("transactions.csv", parse_dates=["date"])
tx["revenue"] = tx["quantity"] * tx["unit_price"]
tx["month"] = tx["date"].dt.to_period("M")
print(tx.dtypes)
print(tx["date"].min().date(), "to", tx["date"].max().date())
print("total revenue:", f"₹{tx['revenue'].sum():,}")date datetime64[ns]
region object
product object
quantity int64
unit_price int64
revenue int64
month period[M]
dtype: object
2025-07-01 to 2026-06-30
total revenue: ₹25,751,700Step 3: Monthly summary#
import pandas as pd

tx = pd.read_csv("transactions.csv", parse_dates=["date"])
tx["revenue"] = tx["quantity"] * tx["unit_price"]
tx["month"] = tx["date"].dt.to_period("M")

monthly = tx.groupby("month").agg(orders=("revenue", "size"), revenue=("revenue", "sum"))
monthly["avg_order_value"] = (monthly["revenue"] / monthly["orders"]).round(0)
monthly["growth_pct"] = (monthly["revenue"].pct_change() * 100).round(1)
print(monthly)
print("best month:", monthly["revenue"].idxmax()) orders revenue avg_order_value growth_pct
month
2025-07 331 2020900 6105.0 NaN
2025-08 301 1632300 5423.0 -19.2
2025-09 306 1671300 5462.0 2.4
2025-10 337 2436700 7231.0 45.8
2025-11 326 2446500 7505.0 0.4
2025-12 351 2193300 6249.0 -10.3
2026-01 345 2275000 6594.0 3.7
2026-02 335 2448900 7310.0 7.6
2026-03 350 2344500 6699.0 -4.3
2026-04 327 2078300 6356.0 -11.4
2026-05 365 2047800 5610.0 -1.5
2026-06 326 2156200 6614.0 5.3
best month: 2026-02Step 4: Top products and regions#
import pandas as pd

tx = pd.read_csv("transactions.csv", parse_dates=["date"])
tx["revenue"] = tx["quantity"] * tx["unit_price"]
tx["month"] = tx["date"].dt.to_period("M")

products = tx.groupby("product").agg(units=("quantity", "sum"), revenue=("revenue", "sum"))
products["share_pct"] = (products["revenue"] / products["revenue"].sum() * 100).round(1)
print(products.sort_values("revenue", ascending=False))

regions = pd.pivot_table(tx, index="region", columns="month", values="revenue", aggfunc="sum")
print((regions / 1000).round(0).iloc[:, -3:]) # last three months, in ₹ thousands units revenue share_pct
product
Monitor 822 9864000 38.3
Headphones 2179 5447500 21.2
Webcam 1339 4017000 15.6
Keyboard 1666 2499000 9.7
Mouse 3446 2412200 9.4
USB Hub 1680 1512000 5.9
month 2026-04 2026-05 2026-06
region
East 360.0 373.0 548.0
North 666.0 562.0 692.0
South 631.0 665.0 679.0
West 421.0 448.0 236.0Monitors sell few units but, at ₹12,000 each, bring in the largest share of revenue; mice sell the most units but earn little. Knowing both the unit and revenue view prevents wrong conclusions.
Step 5: The trend chart#
import pandas as pd
import matplotlib.pyplot as plt
from matplotlib.ticker import FuncFormatter

tx = pd.read_csv("transactions.csv", parse_dates=["date"])
tx["revenue"] = tx["quantity"] * tx["unit_price"]
monthly = tx.groupby(tx["date"].dt.to_period("M"))["revenue"].sum()

fig, ax = plt.subplots(figsize=(9, 4))
ax.bar(monthly.index.strftime("%b %y"), monthly.values / 1e5, color="#4C72B0")
ax.yaxis.set_major_formatter(FuncFormatter(lambda v, _: f"₹{v:.0f}L"))
ax.set_title("Monthly revenue", loc="left")
ax.spines[["top", "right"]].set_visible(False)
best = monthly.values.argmax()
ax.patches[best].set_color("#C44E52")
fig.tight_layout()
fig.savefig("revenue_trend.png", dpi=150)
plt.show()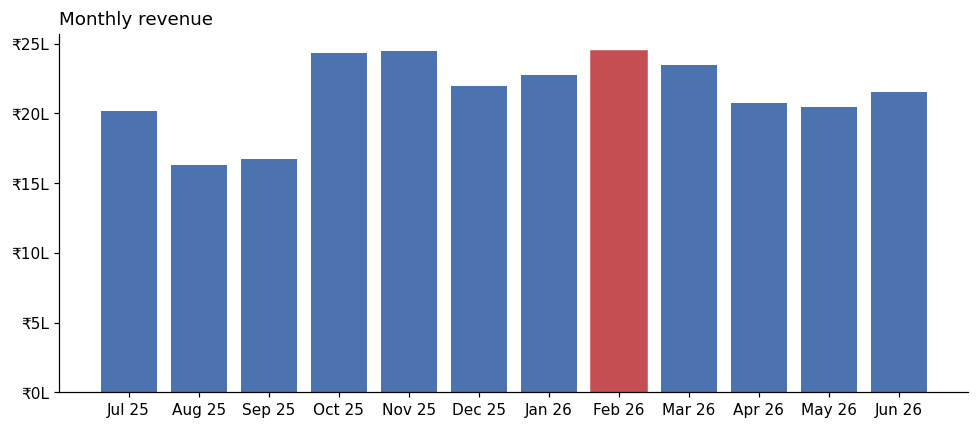
Highlighting the best month in a different colour tells the reader where to look.
Step 6: Export to Excel#
One workbook, one sheet per table, ready to email:
import pandas as pd

tx = pd.read_csv("transactions.csv", parse_dates=["date"])
tx["revenue"] = tx["quantity"] * tx["unit_price"]
tx["month"] = tx["date"].dt.to_period("M").astype(str)

monthly = tx.groupby("month").agg(orders=("revenue", "size"), revenue=("revenue", "sum"))
monthly["growth_pct"] = (monthly["revenue"].pct_change() * 100).round(1)
products = tx.groupby("product")["revenue"].sum().sort_values(ascending=False)
regions = pd.pivot_table(tx, index="region", columns="month", values="revenue", aggfunc="sum")

with pd.ExcelWriter("sales_report.xlsx") as writer:
    monthly.to_excel(writer, sheet_name="Monthly")
    products.to_excel(writer, sheet_name="Products")
    regions.to_excel(writer, sheet_name="Regions")
    tx.to_excel(writer, sheet_name="Transactions", index=False)

with pd.ExcelFile("sales_report.xlsx") as book:
    print(book.sheet_names)
print(pd.read_excel(book, sheet_name="Products"))['Monthly', 'Products', 'Regions', 'Transactions']
product revenue
0 Monitor 9864000
1 Headphones 5447500
2 Webcam 4017000
3 Keyboard 2499000
4 Mouse 2412200
5 USB Hub 1512000Step 7: Make it reusable#
Wrap the steps in a function so next month's report is one call:
import pandas as pd

def build_report(csv_path, out_path):
    tx = pd.read_csv(csv_path, parse_dates=["date"])
    tx["revenue"] = tx["quantity"] * tx["unit_price"]
    tx["month"] = tx["date"].dt.to_period("M").astype(str)
    monthly = tx.groupby("month").agg(orders=("revenue", "size"), revenue=("revenue", "sum"))
    monthly["growth_pct"] = (monthly["revenue"].pct_change() * 100).round(1)
    products = tx.groupby("product")["revenue"].sum().sort_values(ascending=False)
    with pd.ExcelWriter(out_path) as writer:
        monthly.to_excel(writer, sheet_name="Monthly")
        products.to_excel(writer, sheet_name="Products")
    latest = monthly.iloc[-1]
    return f"{monthly.index[-1]}: revenue ₹{int(latest['revenue']):,}, growth {latest['growth_pct']}%"

print(build_report("transactions.csv", "report_latest.xlsx"))2026-06: revenue ₹2,156,200, growth 5.3%Scheduled with Windows Task Scheduler or cron, a script like this produces the report automatically every month.
Practice#
Practice exercise
Add a "Weekday" analysis: using transactions.csv, print total revenue for each day of the week (Monday first) and the day with the highest average revenue per transaction.
Show hint
tx["date"].dt.day_name(), then groupby and reindex with the weekday names in order.
Show solution
import pandas as pd

tx = pd.read_csv("transactions.csv", parse_dates=["date"])
tx["revenue"] = tx["quantity"] * tx["unit_price"]
tx["weekday"] = tx["date"].dt.day_name()
days = ["Monday", "Tuesday", "Wednesday", "Thursday", "Friday", "Saturday", "Sunday"]
print(tx.groupby("weekday")["revenue"].sum().reindex(days))
print(tx.groupby("weekday")["revenue"].mean().idxmax())weekday
Monday 3835100
Tuesday 3770800
Wednesday 3625900
Thursday 3583400
Friday 3301500
Saturday 3833900
Sunday 3801100
Name: revenue, dtype: int64
SaturdayThis data was generated with no weekday effect at all, so the differences between days (including Friday's lower total) come purely from chance. Before acting on a weekday pattern in real data, check that it holds across several months. In real data, a clear weekday pattern would help plan staffing and promotions.
Key takeaway#
Next, prepare for interviews: Beginner Questions.
Finished this lesson?