Python for Data course menu
Plotting with pandas: df.plot for Quick Charts
Make quick charts straight from pandas Series and DataFrames with .plot: line, bar, stacked bar, histogram, box and scatter plots, plotting grouped and resampled data, and customising the result with matplotlib.
On this page
Every pandas Series and DataFrame has a .plot method that draws a matplotlib chart in one line, using the index as the x axis and each column as a series. It is the fastest way to look at data while you explore.
Line charts from a DataFrame#
import numpy as np
import pandas as pd
import matplotlib.pyplot as plt

rng = np.random.default_rng(9)
days = pd.date_range("2026-01-01", periods=120, freq="D")
traffic = pd.DataFrame({
    "web": 1000 + np.arange(120) * 4 + rng.normal(0, 60, 120),
    "app": 600 + np.arange(120) * 7 + rng.normal(0, 60, 120),
}, index=days)

ax = traffic.rolling(7).mean().plot(figsize=(8, 4), title="Daily visitors (7-day average)")
ax.set_ylabel("Visitors")
plt.show()
print(traffic.resample("ME").sum().round(0).astype(int)) web app
2026-01-31 33070 21943
2026-02-28 32478 25760
2026-03-31 40089 34487
2026-04-30 43161 39767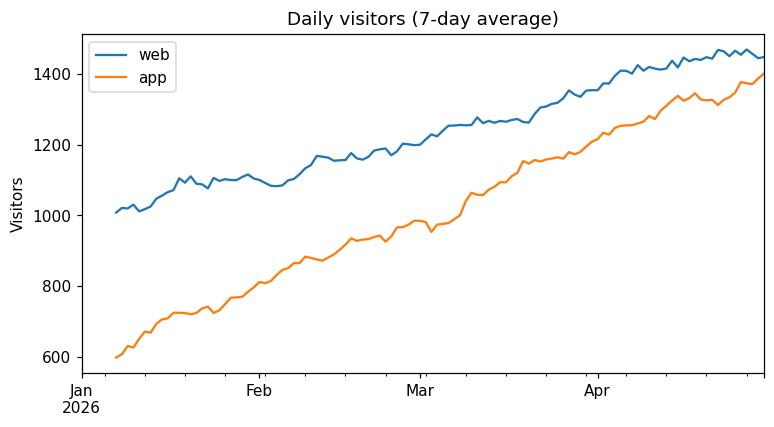
With a date index, pandas formats the x axis as dates automatically. .plot returns the matplotlib Axes, so you can keep customising it.
Bar charts from grouped data#
groupby results plot naturally as bars:
import pandas as pd
import matplotlib.pyplot as plt

sales = pd.DataFrame({
    "region": ["North", "South", "North", "East", "South", "North", "East", "South"],
    "product": ["Pen", "Pen", "Book", "Pen", "Book", "Pen", "Book", "Book"],
    "revenue": [200, 80, 300, 140, 750, 60, 900, 150],
})
fig, axes = plt.subplots(1, 2, figsize=(11, 4))
sales.groupby("region")["revenue"].sum().sort_values().plot.barh(ax=axes[0], title="Revenue by region")
sales.pivot_table(index="region", columns="product", values="revenue", aggfunc="sum") \
     .plot.bar(stacked=True, ax=axes[1], title="Revenue by region and product", rot=0)
fig.tight_layout()
plt.show()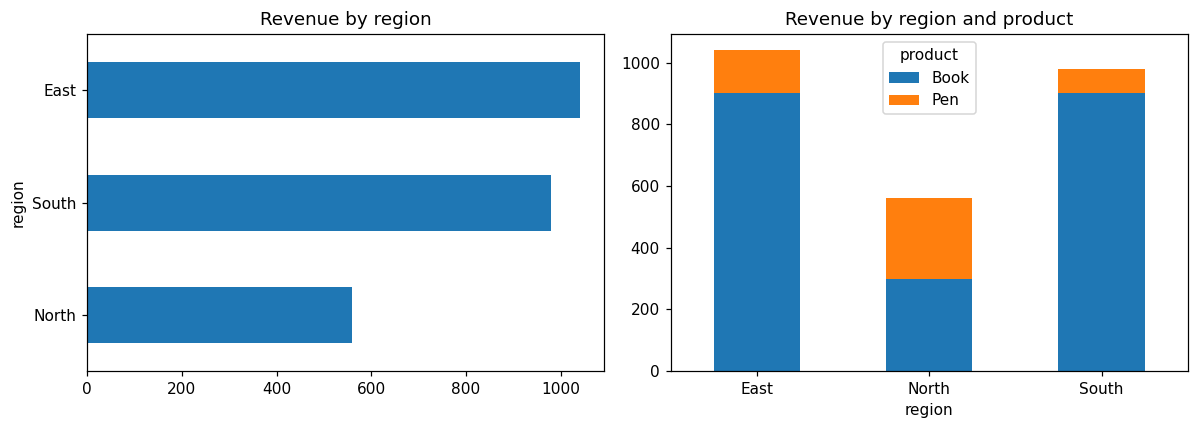
A pivot table becomes a grouped or stacked bar chart directly, because each column becomes one series. rot=0 keeps the category labels horizontal.
Distributions and relationships#
import numpy as np
import pandas as pd
import matplotlib.pyplot as plt

rng = np.random.default_rng(5)
orders = pd.DataFrame({
    "amount": rng.gamma(shape=2.0, scale=300, size=400).round(0),
    "items": rng.integers(1, 8, 400),
})
orders["amount"] += orders["items"] * 80

fig, axes = plt.subplots(1, 3, figsize=(13, 3.8))
orders["amount"].plot.hist(bins=30, ax=axes[0], title="Order amount")
orders["amount"].plot.box(ax=axes[1], title="Order amount")
orders.plot.scatter(x="items", y="amount", alpha=0.4, ax=axes[2], title="Amount vs items")
fig.tight_layout()
plt.show()
print(orders["amount"].describe().round(1))count 400.0
mean 937.7
std 435.0
min 109.0
25% 621.5
50% 864.5
75% 1181.8
max 2717.0
Name: amount, dtype: float64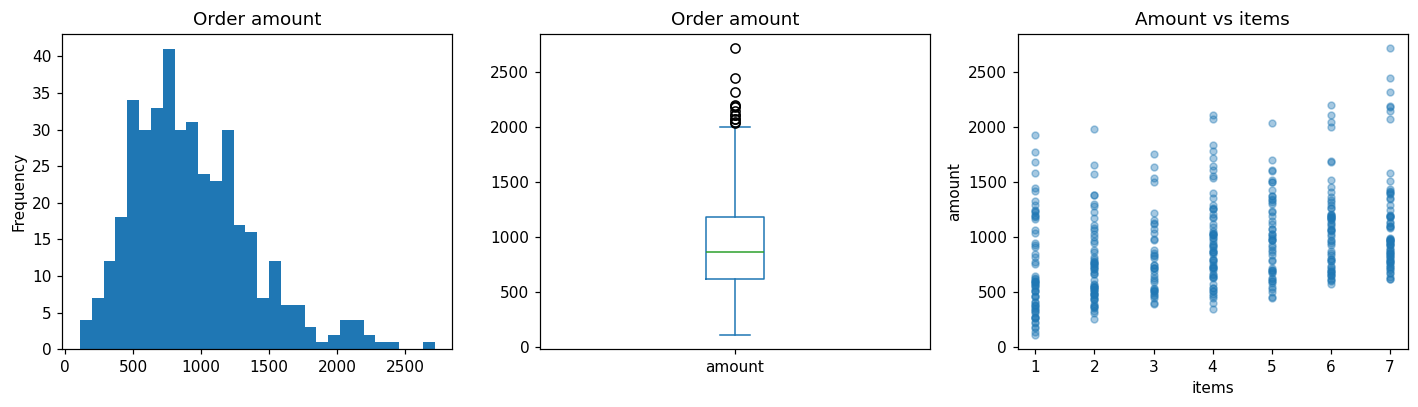
The kinds available#
When to switch to matplotlib or seaborn#
pandas plotting is ideal for quick looks during analysis. For charts in a report, you will usually customise with matplotlib (titles, formatting, annotations) or switch to seaborn for statistical charts with grouping and confidence intervals. Because .plot returns a normal matplotlib Axes, you can mix all three.
Common mistakes#
Practice#
Practice exercise
Monthly expenses by category are {"Jan": [15000, 6200, 1800], "Feb": [15000, 5800, 2600], "Mar": [15000, 7100, 1200]} for rent, food and travel. Build a DataFrame with months as rows and categories as columns, draw a stacked bar chart, and print each month's total.
Show hint
pd.DataFrame.from_dict(data, orient="index", columns=[...]) makes months the rows. .plot.bar(stacked=True) and .sum(axis=1).
Show solution
import pandas as pd
import matplotlib.pyplot as plt

data = {"Jan": [15000, 6200, 1800], "Feb": [15000, 5800, 2600], "Mar": [15000, 7100, 1200]}
expenses = pd.DataFrame.from_dict(data, orient="index", columns=["rent", "food", "travel"])
ax = expenses.plot.bar(stacked=True, rot=0, figsize=(6, 4), title="Monthly expenses (₹)")
plt.show()
print(expenses.sum(axis=1))Jan 23000
Feb 23400
Mar 23300
dtype: int64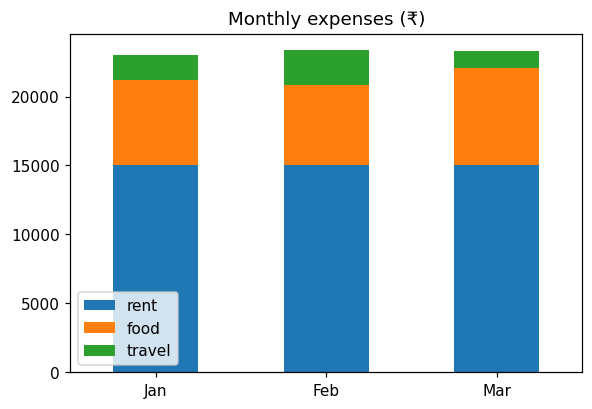
Key takeaway#
Next, put it all together: Project: Exploratory Data Analysis.
Finished this lesson?