Python for Data course menu
Data Distributions in Python: Histograms, Normal Distribution and Z-scores
Understand the shape of data: histograms, the normal distribution and the 68-95-99.7 rule, skewed and uniform distributions, z-scores, and probabilities from scipy.stats with norm.cdf and norm.ppf.
On this page
A distribution describes how often each value occurs: which values are common, which are rare, and whether the data is symmetric or lopsided. Two datasets can have the same mean and standard deviation but very different shapes, so it pays to look.
Histograms show the shape#
A histogram splits the range of values into bins and counts how many values fall into each. Here are 1,000 simulated heights (normally distributed) and 1,000 simulated delivery times (right-skewed):
import numpy as np
import matplotlib.pyplot as plt

rng = np.random.default_rng(7)
heights = rng.normal(loc=165, scale=8, size=1000)
deliveries = rng.exponential(scale=10, size=1000) + 20

fig, axes = plt.subplots(1, 2, figsize=(10, 4))
axes[0].hist(heights, bins=30, color="#4C72B0", edgecolor="white")
axes[0].set_title("Heights (cm): symmetric")
axes[1].hist(deliveries, bins=30, color="#DD8452", edgecolor="white")
axes[1].set_title("Delivery time (min): right-skewed")
for ax in axes:
    ax.set_ylabel("Count")
plt.tight_layout()
plt.show()

print(round(heights.mean(), 1), round(np.median(heights), 1))
print(round(deliveries.mean(), 1), round(np.median(deliveries), 1))164.4 164.5
30.2 26.9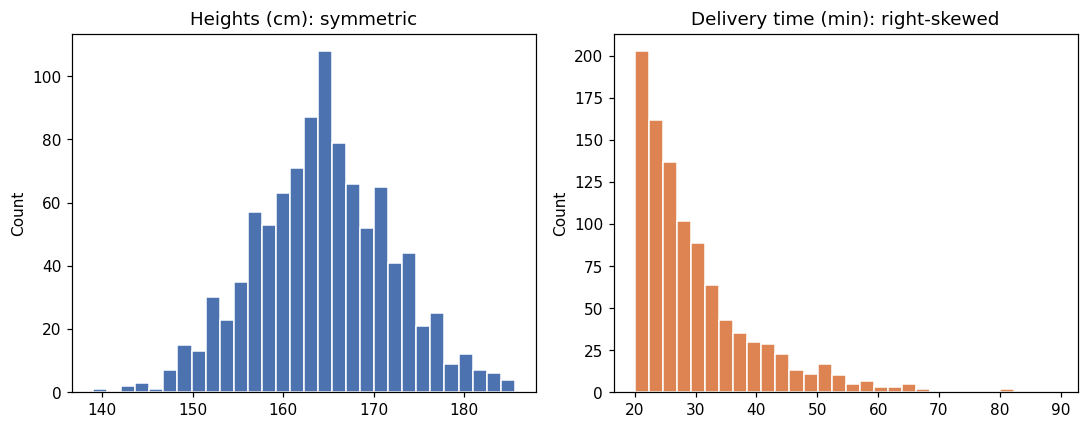
For the symmetric heights, mean and median are almost equal. For the skewed delivery times, the long right tail pulls the mean above the median.
The normal distribution#
The normal (Gaussian) distribution is the familiar bell curve. It is described by its mean μ (the centre) and standard deviation σ (the width). Many measurements are roughly normal: heights, measurement errors, averages of many small effects.
The 68-95-99.7 rule: about 68% of values lie within 1σ of the mean, 95% within 2σ and 99.7% within 3σ. We can check it on simulated data:
import numpy as np

rng = np.random.default_rng(7)
heights = rng.normal(loc=165, scale=8, size=100_000)
for k in [1, 2, 3]:
    within = (np.abs(heights - 165) <= k * 8).mean()
print(f"within {k} sd: {within:.1%}")within 1 sd: 68.3%
within 2 sd: 95.4%
within 3 sd: 99.8%Exact probabilities with scipy.stats#
scipy.stats.norm gives exact normal probabilities. cdf(x) is the probability of a value at most x; ppf(p) goes the other way and gives the value below which a fraction p falls:
from scipy.stats import norm

mu, sigma = 165, 8
print(round(norm.cdf(173, mu, sigma), 4))                          # P(height <= 173)
print(round(1 - norm.cdf(181, mu, sigma), 4))                      # P(height > 181)
print(round(norm.cdf(173, mu, sigma) - norm.cdf(157, mu, sigma), 4))  # within 1 sd
print(round(norm.ppf(0.95, mu, sigma), 1)) # 95th percentile0.8413
0.0228
0.6827
178.2Exactly 68.27% lies within one standard deviation, which is where the "68" in the rule comes from. A height of 181 cm (2σ above the mean) is exceeded by only about 2.3% of people.
Z-scores#
A z-score expresses a value as "how many standard deviations from the mean": z = (x − μ) / σ. It puts values on different scales on a common footing:
import pandas as pd

scores = pd.DataFrame({
    "subject": ["Maths", "English"],
    "score": [78, 82],
    "class_mean": [65, 78],
    "class_std": [10, 4],
})
scores["z"] = (scores["score"] - scores["class_mean"]) / scores["class_std"]
print(scores) subject score class_mean class_std z
0 Maths 78 65 10 1.3
1 English 82 78 4 1.082 in English looks better than 78 in Maths, but relative to their classes, the Maths score is stronger (1.3 standard deviations above the mean versus 1.0).
Other common shapes#
Skewed data is often analysed on a log scale (np.log), which makes it closer to symmetric.
Common mistakes#
Practice#
Practice exercise
Exam scores are normal with mean 70 and standard deviation 12. Using scipy.stats.norm, print (rounded to 3 decimals) the probability that a student scores above 90, the probability of scoring between 60 and 80, and the score needed to be in the top 10%.
Show hint
Above 90: 1 - norm.cdf(90, 70, 12). Between: the difference of two cdf values. Top 10%: norm.ppf(0.9, 70, 12).
Show solution
from scipy.stats import norm

print(round(1 - norm.cdf(90, 70, 12), 3))
print(round(norm.cdf(80, 70, 12) - norm.cdf(60, 70, 12), 3))
print(round(norm.ppf(0.9, 70, 12), 1))0.048
0.595
85.4Key takeaway#
Next: how two variables move together, in Correlation.
Finished this lesson?